



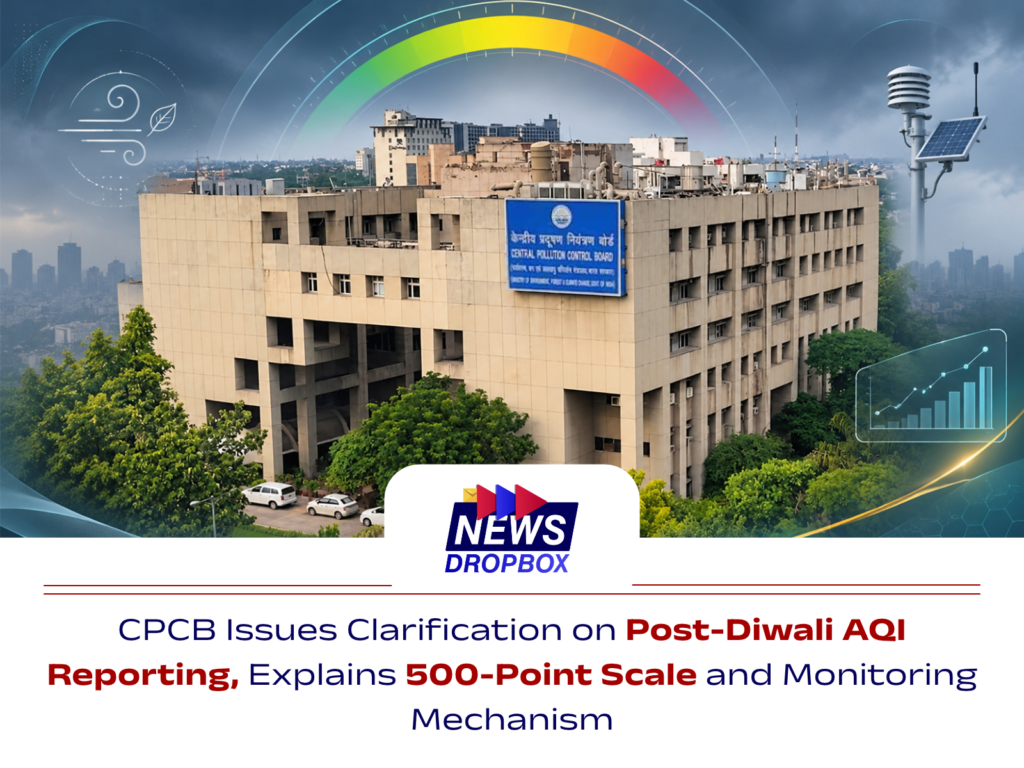
The Central Pollution Control Board (CPCB) has issued a detailed clarification on the National Air Quality Index (NAQI), explaining its calculation methodology, health categories and monitoring framework amid post-Diwali air quality discussions. The clarification also outlines the expansion of India’s air quality monitoring network and the scientific basis of official AQI reporting.
New Delhi: The Central Pollution Control Board (CPCB), under the Ministry of Environment, Forest and Climate Change, has issued a detailed clarification on the reporting of the National Air Quality Index (NAQI), explaining its methodology, the significance of the 500-point scale and the functioning of India’s air quality monitoring system.
The clarification comes amid discussions over post-Diwali air quality readings, including differences between AQI values reported by CPCB and other digital platforms.
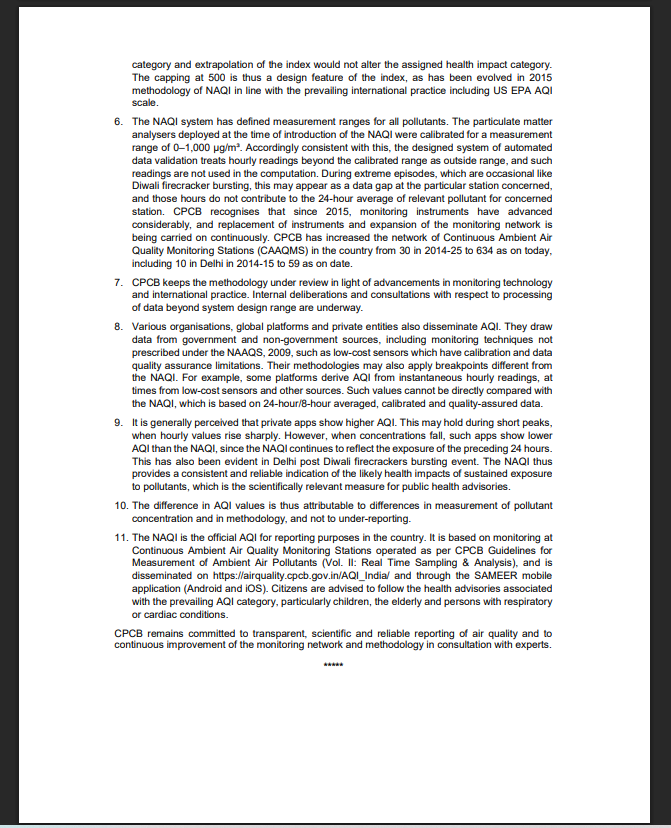
Understanding India’s National Air Quality Index
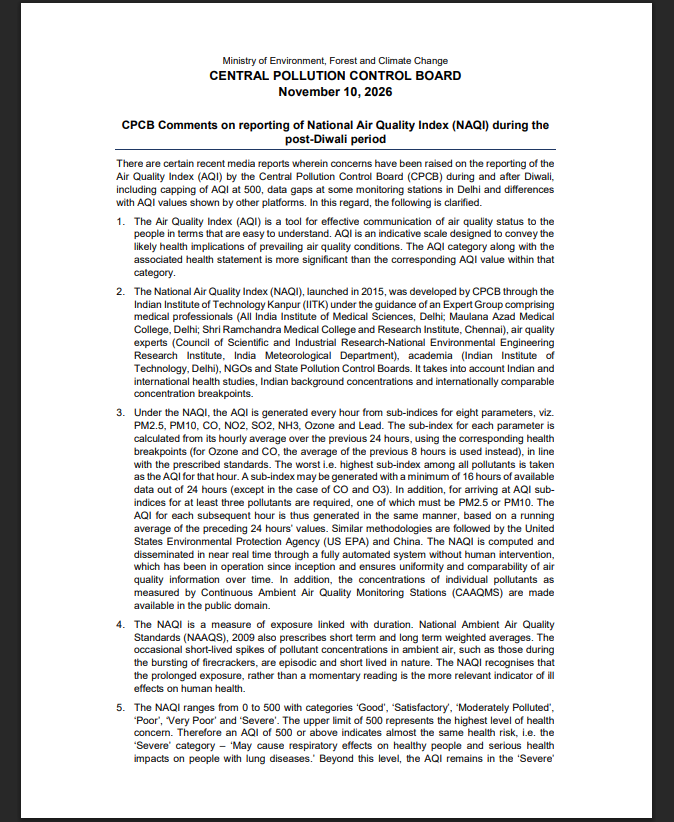
The National Air Quality Index was launched in 2015 and developed by CPCB through the Indian Institute of Technology (IIT), Kanpur, with inputs from medical professionals, air quality experts, research institutions, academia and other technical organisations.
The AQI is designed to communicate air quality conditions and their potential health implications in an easily understandable format. The associated health advisory provides important information about the possible effects of prevailing air quality conditions.
The index classifies air quality into six categories: Good, Satisfactory, Moderately Polluted, Poor, Very Poor and Severe.
How is the AQI calculated?
According to CPCB, the National AQI is generated every hour using eight air quality parameters: PM2.5, PM10, Carbon Monoxide (CO), Nitrogen Dioxide (NO2), Sulphur Dioxide (SO2), Ammonia (NH3), Ozone and Lead.
For most parameters, the sub-index is calculated using the hourly average of the preceding 24 hours. For ozone and carbon monoxide, an eight-hour average is also considered.
The highest sub-index among the available parameters determines the overall AQI for that hour. For calculating the AQI, data from at least three pollutants are required, including at least one of PM2.5 or PM10.
The subsequent hourly AQI is generated using a running average of the preceding 24 hours.
What does the 500-point AQI scale indicate?
Clarifying the significance of the AQI’s upper limit, CPCB stated that the index ranges from 0 to 500, with 500 representing the highest level of health concern on the existing scale.
An AQI value of 500 or above falls under the Severe category. The health advisory for this category indicates that healthy people may experience respiratory effects, while people with lung diseases may face serious health impacts.
The board explained that the 500-point limit is a feature of the index methodology introduced in 2015. Extrapolation of the index beyond this value does not change its assigned health impact category.
Expansion of India’s air quality monitoring network
Highlighting developments in air quality monitoring infrastructure, CPCB stated that the number of Continuous Ambient Air Quality Monitoring Stations (CAAQMS) across the country has increased from 30 in 2014-15 to 634 as of November 2026.
In Delhi, the monitoring network has expanded from 10 stations in 2014-15 to 59 stations.
The board also noted that monitoring instruments have advanced considerably since the introduction of the AQI system, with improvements in instrumentation, data validation and monitoring network coverage.
Understanding differences in AQI readings across platforms
CPCB also explained that different organisations, global platforms and private applications may report varying AQI values because of differences in data sources, monitoring instruments, calibration standards and calculation methodologies.
Some platforms use low-cost sensors and may report instantaneous readings, while the official NAQI follows prescribed averaging periods and calibrated, quality-assured data.
The board noted that the official AQI reflects pollutant exposure over the preceding 24 hours, making it a measure linked to the duration of exposure rather than a momentary reading.
Monitoring during high-pollution episodes
The clarification also explains the measurement ranges of particulate matter analysers used in the monitoring network.
According to CPCB, the analysers deployed at the time of the introduction of the NAQI were calibrated for a measurement range of 0–1,000 µg/m³. Readings beyond the calibrated range are treated as outside-range observations and are not used in the computation.
The board stated that during extreme pollution episodes, including intense firecracker activity, this may result in data gaps at particular monitoring stations. Such hours do not contribute to the 24-hour average of the relevant pollutant for the concerned station.
Continuous review of AQI methodology
CPCB stated that the AQI methodology is periodically reviewed in light of advancements in monitoring technology and international practices. Internal deliberations and consultations are also underway regarding the processing of data beyond the existing measurement range.
The board further clarified that the National AQI is the official index for reporting air quality in India. It is based on monitoring conducted at Continuous Ambient Air Quality Monitoring Stations operating as per CPCB guidelines.
Air quality information is made available through the official portal, airquality.cpcb.gov.in/AQI_India, and the SAMEER mobile application.
Concluding its statement, CPCB reaffirmed its commitment to transparent, scientific and reliable air quality reporting, along with the continuous improvement of the monitoring network and methodology in consultation with experts.
***